Flood Risk Tools: Dataset and Product Descriptions
Besides the updated Flood Insurance Rate Maps (FIRMs) and Flood Insurance Study (FIS) reports being developed based on the coastal flood study underway, FEMA, in partnership with the New Jersey Department of Environmental Protection, is also providing communities with additional tools they can use in planning efforts to reduce (or “mitigate”) flood risk, communicate with the public, and create a dialogue with neighboring communities about ways to reduce future flood risk. This page provides a description of the tools being developed. Visit the Flood Risk Tools main page to access tools which have been released.
The flood risk tools consist of flood risk datasets and flood risk products which provide a summary of the datasets and results. Both flood risk datasets and products are described in the sections below.
Flood Risk Tools: Datasets
Coastal Flood Risk Assessment
“Risk assessment” is a process to identify potential hazards and to analyze what could happen if the hazard does occur. The coastal flood risk assessment dataset provides estimates of potential flood damage based on the new coastal flood study results using FEMA’s Hazus loss estimation software. The data, which can be incorporated into local hazard mitigation plans, can help guide community mitigation efforts by highlighting areas where risk reduction actions are needed and will have the biggest impact.
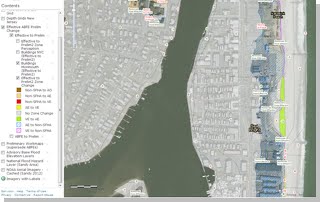
Changes Since Last FIRM
The Changes Since Last FIRM (CSLF) dataset compares information shown on the preliminary FIRM with that of the effective FIRM. This includes a comparison of the floodplain boundaries and zones, Base Flood Elevation changes, and where applicable, the regulatory floodway. The dataset also includes information about why changes are happening in particular areas and indicates where no changes are occurring as well. It can be used to help explain map changes to residents and to identify areas newly mapped in high risk flood zones where outreach efforts may need to be focused. It can also be used to inform planning decisions and to prioritize mitigation measures. For draft versions of the CSLF dataset, preliminary work map data will be compared with the effective FIRM. For final versions, the preliminary FIRM will be compared with the effective FIRM.
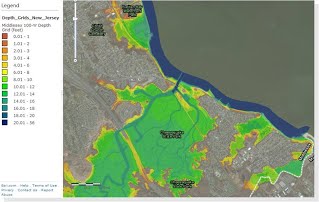
Flood Depth Grids and Water Surface Elevation Change Grids
Flood Depth Grids
A flood depth grid is a dataset of grid cells which show the depth of the 1% annual chance flood for any given location within the study area. Depth grids can be used by communities to identify high risk areas and to help prioritize and evaluate the cost effectiveness of mitigation measures. Flood depth is often easier for people to understand than Base Flood Elevations shown on the FIRMs. Thus, depth grids can be effective outreach tools for communicating with the public about local flood risk. For draft versions of the flood depth grids, preliminary work map data will be used. For final versions, the preliminary FIRM data will be used instead.
Water Surface Elevation Change Grids
Similar to the flood depth grid is the Water Surface Elevation Change Grid which shows the change in the 1% annual chance water surface elevation between the existing and revised mapped floodplain.
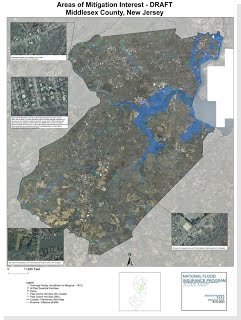
Areas of Mitigation Interest
This dataset shows areas where local factors may have an impact (positive or negative) on the identified flood risk. Areas with a history of flood claims, structures that contribute to flooding problems (e.g., undersized culverts or bridges), and areas experiencing land use change or development can be included in this dataset. By identifying these factors, this dataset can help communities identify and prioritize potential mitigation opportunities. It also allows communities to see factors present in neighboring communities which may affect them, fostering collaboration on mitigation projects.
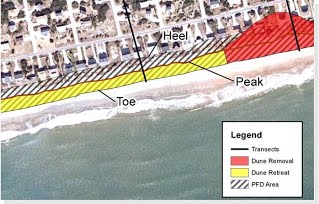
Primary Frontal Dune (PFD) Erosion Areas
The Primary Frontal Dune (PFD) is a mound or ridge of sand with relatively steep seaward and landward slopes immediately landward and adjacent to the beach which is subject to erosion and overtopping from high tides and waves during major storms. The PFD, where present, is used to delineate the limit of the coastal high hazard area (also known as the ‘V zone’) shown on the FIRM. This dataset shows the erosion areas associated with the PFD which can be used for mitigation planning and outreach efforts.
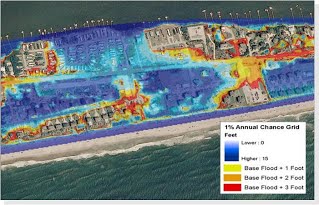
Coastal Increased Inundation Areas
This dataset shows hypothetical increases of 1, 2, and 3 feet in total water levels along the coast using the inland extent of 1% annual chance flooding shown on the flood depth grid (see description above). The coastal increased inundation areas dataset is a valuable tool for long term planning efforts in coastal communities.
Flood Risk Tools: Products
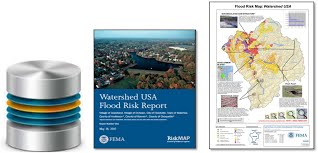
Flood Risk Database
The Flood Risk Database contains all of the flood risk datasets listed above. The database files are accessed using specialized GIS software that many communities use for planning, permitting, and other purposes. The Flood Risk Database can be used to develop customized maps to communicate with the public about flood risk and to overlay with other datasets the community may have for planning efforts and/or further flood risk analysis. The Flood Risk Database parallels, but is separate from, the regulatory FIRM database.
Flood Risk Report
The Flood Risk Report summarizes the flood risk datasets listed above and provides readers with an understanding of local flood risk exposure. The risk assessment information included in the report can be used to develop and prioritize mitigation strategies and can be incorporated into local hazard mitigation plans. The information in this report can also be used to help communicate with the general public about local flood risk. The Flood Risk Report parallels, but is separate from, the FIS report which accompanies the FIRM.
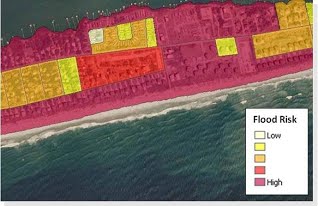
Flood Risk Map
The Flood Risk Map shows flood risk in the study area using the flood risk datasets listed above. The map is intended to provide a high level overview of the study area to help community officials identify flood risk “hot spots” and to promote coordination with neighboring communities. The Flood Risk Map parallels, but is separate from, the community FIRM.