Coastal Mapping Basics
The effects of tides, combined with large amounts of water and waves from storms make coastal areas some of the most at-risk areas for flooding. To map coastal flood hazards accurately, many factors must be taken into account, such as the amount of development in the area, the types and strength of storms that historically have affected the area, and onshore and offshore elevations. This page explains the steps involved to identify and map the coastal flood hazards shown on FEMA Flood Insurance Rate Maps (FIRMs). The FIRM is used to determine flood insurance requirements for residents and where floodplain development regulations apply in a community.
Special Flood Hazard Areas and Base Flood Elevations
Each FIRM shows Special Flood Hazard Areas (SFHAs) which are the areas of the flood that has a one percent chance of being equaled or exceeded in any given year. The SFHA includes all ‘A’ and ‘V’ FIRM zones, the most common being: A, AO, AH, AE, VE, and V. Insurance rates and building requirements are tied to SFHA boundaries and the Base Flood Elevations (BFEs) that are established for these areas and shown on the FIRM. A BFE is the water level expected in the SFHA for a 1%-annual-chance flood event. To accurately develop and map coastal SFHAs and BFEs, study teams made up of engineers, coastal scientists, surveyors, and mapping specialists prepare coastal flood studies that include storm surge analysis and overland wave modeling. The process is described below.
Transects and Field Reconnaissance
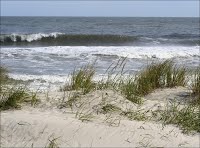
The coastal models used in developing a coastal flood study (discussed further below) need to account for land features in the study area such as coastline bluffs, dunes, and beaches. FEMA uses cross-shore transects, or lines drawn on maps placed at points along the shoreline of open coast areas and bays, to help focus data collection efforts. Field reconnaissance is performed by coastal scientists who collect land use and shoreline information that cannot be determined only from studying aerial imagery. The field reconnaissance process involves physically visiting locations along the planned transects to assess and verify the following:
- Shoreline information including type and beach condition; presence and condition of shore protection structures;
- Structure information including type of building, and approximate first floor elevation;
- Vegetation information including type and other characteristics; and
- Marsh information including grass type(s), grass density, and height.
Learn more by reading the Transect Data and Field Reconnaissance fact sheet.
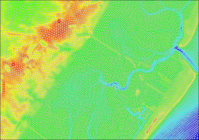
A mesh, or high resolution grid, developed when modeling storm surge
Coastal Storm Surge Analysis
Coastal flooding is usually caused by coastal storms, including tropical storms, hurricanes, and nor’easters. Storm surge is the amount of water, combined with the effect of normal tides that is pushed towards the shore during a storm. The height of the storm surge is driven by many variables, such as the strength and size of the storm, and the speed and direction in which the storm moves. Using information about historical storms that have affected the area, a representative set of storm events are identified and then modeled.
Storm surge analyses for FEMA coastal flood studies are often performed using the ADCIRC (ADvanced CIRCulation) model in conjunction with the Simulating Waves Nearshore (SWAN) model. Once complete, the storm surge analysis will result in the development of stillwater elevations for the 1%-annual-chance flood event.
Get more information on storm surge in the Storm Surge Analysis video at FEMA.gov and the Storm Surge GIS Data fact sheet. You can also access data and summary reports for the storm surge analysis used to prepare the New Jersey/New York coastal flood study on the Find Preliminary FIRM Information page.
Overland Wave Modeling
The storm surge stillwater elevations do not take into account all effects from waves coming ashore during a storm event. Therefore, a separate overland wave modeling analysis is needed in addition to the storm surge analysis to accurately develop coastal SFHAs and BFEs. FEMA typically uses a model called Wave Height Analysis for Flood Insurance Studies (WHAFIS) to perform overland wave modeling. This model takes into account water depth, wind speed, vegetative cover, building density, and other factors to predict the heights of waves, which will affect coastal BFEs and flood zone boundaries. Wave runup and wave setup (discussed below) are also important factors.
The rush of water that extends inland when waves come ashore is called ‘wave runup.’ The overland wave analysis will determine the elevations to which wave runup extends during a storm. These elevations may be higher than the stillwater elevations developed as part of the storm surge analysis.
Besides the effects of wave runup and storm surge, there is also an increase in the water level caused by waves breaking ashore during a storm. This increase is called ‘wave setup’. Wave setup is affected by the height of the waves, the speed at which waves approach the shore, and the slope of the ground near the shore.
Erosion (or, the removal of soil) due to storms and the presence of coastal structures, such as seawalls, is also taken into account when overland wave modeling is performed.
The Coastal Hazard Analysis Modeling Program (CHAMP) is a software program used by coastal engineers to conduct the overland wave modeling discussed above. Learn more by reading the CHAMP fact sheet.

The storm surge stillwater elevation (SWEL) and added effects of wave setup and wave runup.
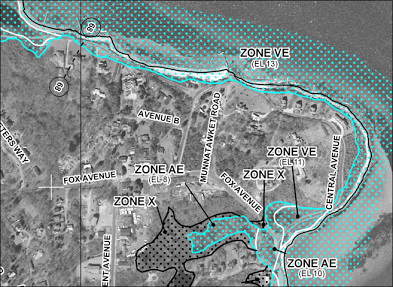
Detail from a coastal FIRM.
Mapping Coastal Hazards
Once the storm surge analysis and overland wave modeling are complete, the most up-to-date topographic (elevation) information available is used to map the SFHA boundaries and flood zones (described below) based on the results of the analyses. BFEs are also added to the FIRM at this point in the process.
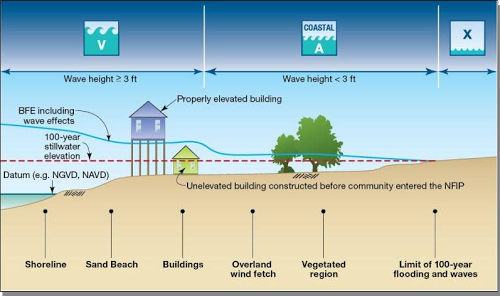
Coastal V and A zones and the added effects of waves on coastal BFEs.
Coastal High Hazard Areas (V Zones)
Coastal high hazard areas, labeled as ‘V zones‘ on the FIRM, are the areas where the computed wave heights for the 1%-annual-chance flood are 3 feet or more. V zones are subject to more stringent building requirements and different flood insurance rates than other zones shown on the FIRM because these areas have a higher level of risk from flooding than other areas.
Coastal A Zones
Portions of the SFHA landward of a V zone (i.e., areas where wave heights are computed as less than 3 feet) are mapped as ‘A zones’ on the FIRM. While the wave forces in coastal A zones are not as severe as those in V zones, there is still an added risk of damage or destruction of buildings.
The Limit of Moderate Wave Action
Another area that may be shown on coastal FIRMs for informational purposes is the Limit of Moderate Wave Action (LiMWA). The LiMWA identifies areas that will be affected by waves with a 1.5 foot wave height or greater within the coastal A zone. While FEMA does not require special floodplain management standards based on LiMWA delineations, it is likely that properties and structures within the LiMWA will receive substantial damage from wave action during a 1%-annual-chance flood event. As a result, communities are encouraged to adopt the more stringent building construction standards applicable for V Zones in these areas.
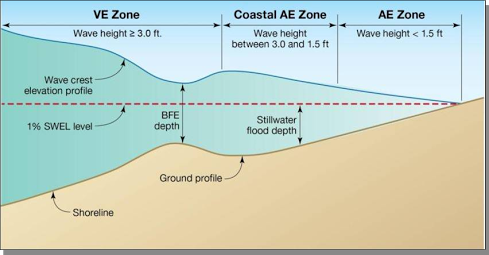
The LiMWA identifies the area where wave heights are between 1.5 and 3 feet.
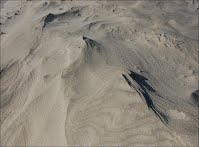
Primary Frontal Dunes
A Primary Frontal Dune (PFD) is a continuous or nearly continuous mound or ridge of sand with relatively steep seaward and landward slopes immediately landward of and adjacent to the beach. PFDs are subject to erosion and may be vulnerable to overtopping or breaching from high water levels and waves during coastal storms. Because dunes can help reduce flood hazards, the National Flood Insurance Program has established special mapping, insurance, and floodplain management criteria designed to help communities protect dunes. For more information about PFDs, read FEMA’s PFD fact sheet.
Learn More
More information about the nation’s coastal resources, including more information on coastal flood risk and storm surge, can be found on FEMA’s Coastal Flood Risks pages. For questions about FEMA’s coastal flood mapping, contact the FEMA Map Information eXchange.